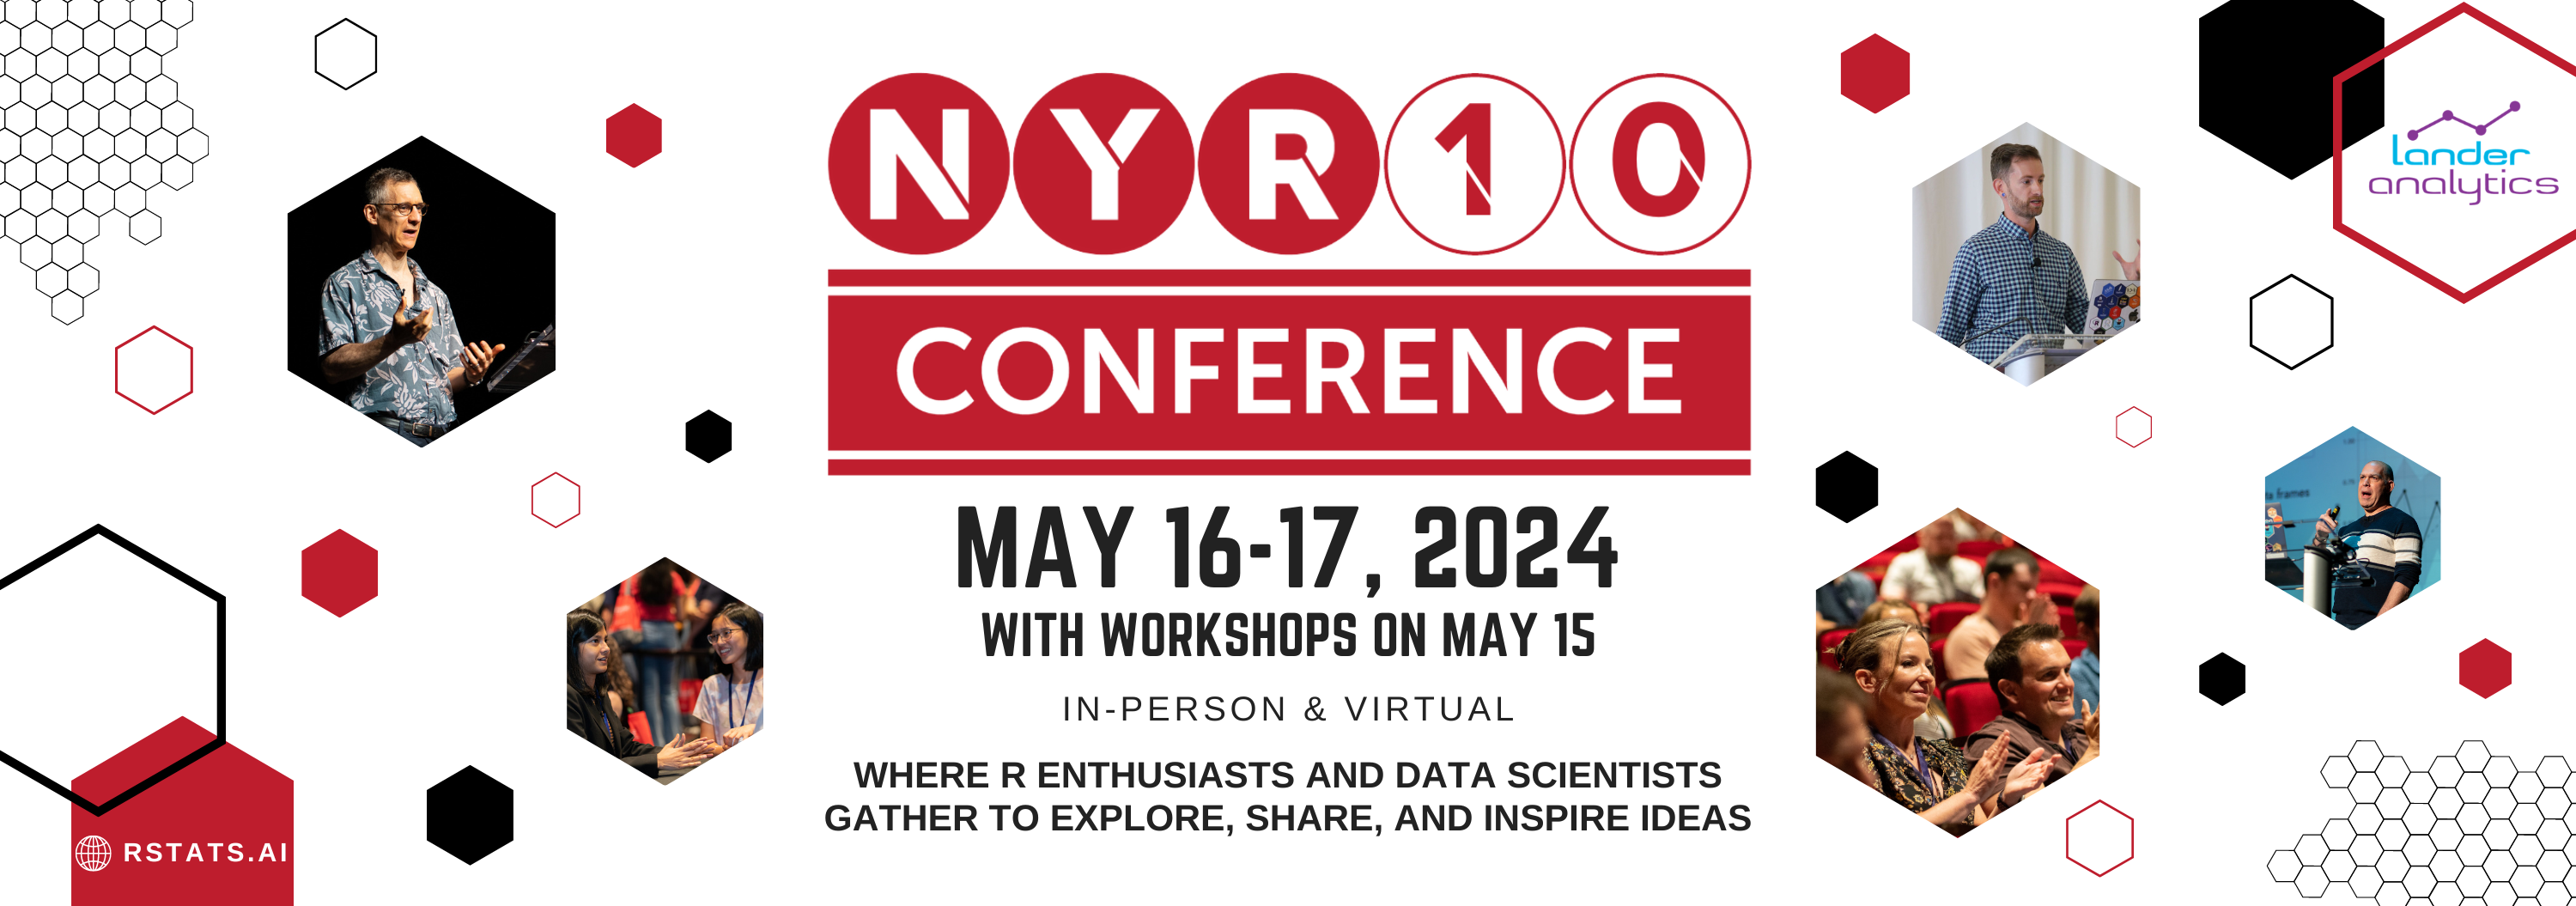
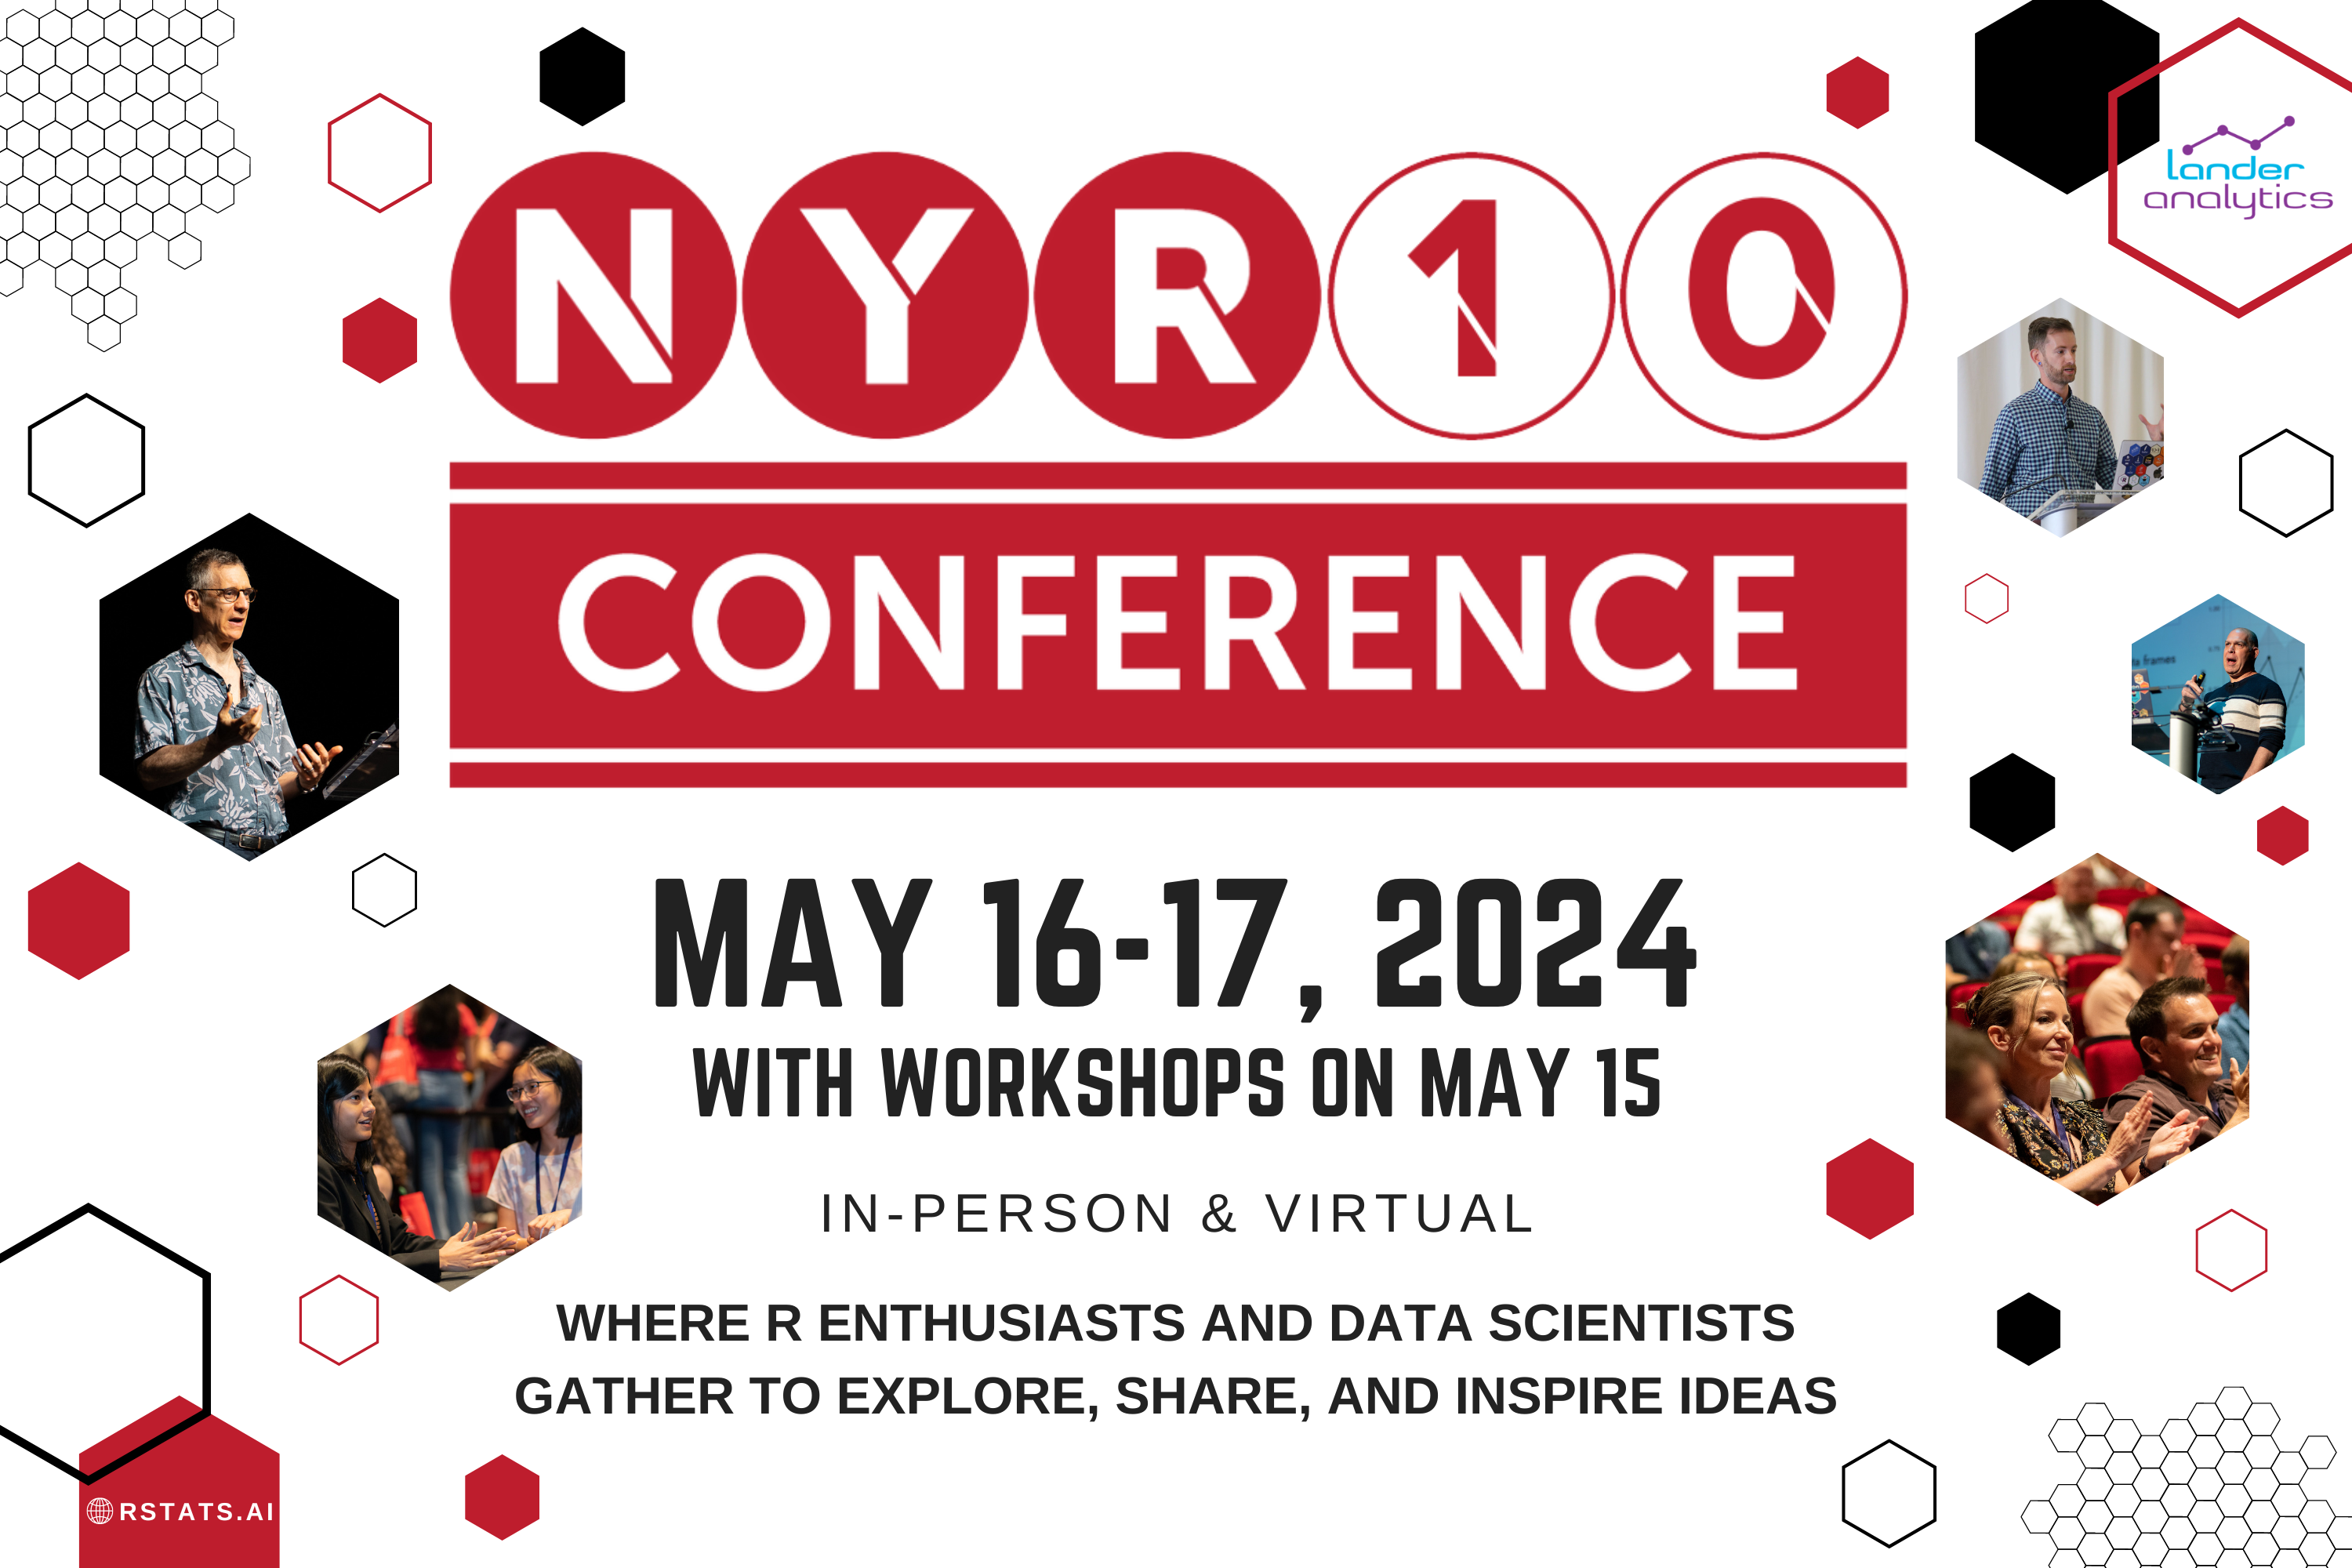
NY R Conference
Thanks for attending the 10th anniversary of the New York R Conference!
Check out the Photo Gallery and Videos ! Stay tuned for 2025 conference details!
Agenda
Wednesday, May 15
-
08:00 AM - 09:00 AM
Registration & Breakfast
-
09:00 AM - 05:00 PM
Workshop: Max Kuhn Scientist @ Posit
Machine Learning in R ...
Join Max Kuhn on a tour through Machine Learning in R, with emphasis on using the software as opposed to general explanations of model building. This workshop is an abbreviated introduction to the tidymodels framework for modeling.
You'll learn about data preparation, model fitting, model assessment and predictions. The focus will be on data splitting and resampling, data pre-processing and feature engineering, model creation, evaluation, and tuning. This is not a deep learning course and will focus on tabular data.
Pre-requisites: some experience with modeling in R and the tidyverse (don't need to be experts); prior experience with lm is enough to get started and learn advanced modeling techniques. In case participants can’t install the packages on their machines, RStudio Server Pro instances will be available that are pre-loaded with the appropriate packages and GitHub repository.
(In-Person & Virtual Ticket Options Available)
-
09:00 AM - 05:00 PM
Workshop: Malcolm Barrett & Lucy D'Agostino McGowan
Causal Inference in R ...
In this workshop, we’ll teach the essential elements of answering causal questions in R through causal diagrams, and causal modeling techniques such as propensity scores and inverse probability weighting.
In both data science and academic research, prediction modeling is often not enough; to answer many questions, we need to approach them causally. In this workshop, we’ll teach the essential elements of answering causal questions in R through causal diagrams, and causal modeling techniques such as propensity scores and inverse probability weighting. We’ll also show that by distinguishing predictive models from causal models, we can better take advantage of both tools. You’ll be able to use the tools you already know--the tidyverse, regression models, and more--to answer the questions that are important to your work.
This course is for you if you:
- Know how to fit a linear regression model in R
- Have a basic understanding of data manipulation and visualization using tidyverse tools
- Are interested in understanding the fundamentals behind how to move from estimating correlations to causal relationships
(In-Person & Virtual Ticket Options Available)
-
09:00 AM - 05:00 PM
Workshop: David Robinson Director of Data Science @ Heap
Exploratory Data Analysis with the Tidyverse ...
The tidyverse is a powerful collection of packages following a standard set of principles for usability. During this workshop David will demonstrate an exploratory data analysis in R using tidy tools. He will demonstrate the use of tools such as dplyr and ggplot2 for data transformation and visualization, as well as other packages from the tidyverse as they're needed. He'll narrate his thought process as attendees follow along and offer their own solutions.
The workshop expects some familiarity with dplyr and ggplot2—enough to work with data using functions like mutate, group_by, and summarize and to create graphs like scatterplots or bar plots in ggplot2. These concepts will be re-introduced to ensure a smooth workshop, but it isn't designed for brand new R programmers.
The workshop is designed to be interactive and participants are expected to type along on their own keyboards.
(In-Person & Virtual Ticket Options)
Thursday, May 16
-
08:00 AM - 08:50 AM
Registration & Breakfast
-
08:50 AM - 09:00 AM
Opening Remarks
-
09:00 AM - 09:20 AM
Megan Robertson Senior Data Scientist @ Freelance
Not Your College Stats Course: Engaging Stakeholders Through Data Science ...
When working in industry data scientists must collaborate with colleagues across many different positions. You need to understand stakeholder needs and communicate results with non-technical teams. While you don't need to share the mathematical details, explaining analyses builds a stronger relationship with stakeholders and helps them to understand the data science process. How do you determine the best way to deliver results? What are some techniques you can use to break down data science techniques and algorithms? This talk will review methods to effectively share data science analysis and why it is important to stay aligned with stakeholders. -
09:25 AM - 09:45 AM
Chang She CEO & Cofounder @ LanceDB
Building Data Tooling in Rust for Multimodal AI ...
AI adoption is bringing a host of new challenges for data management and new workloads. This is especially true for multi-modal AI where data challenges extend far beyond just embeddings and require new tooling for working with images, audio, video, pdfs, and more. Traditional formats and tooling are optimized for purely tabular data and cannot be used effectively to manage unstructured data types. Instead, a new set of infrastructure and tooling are being built, in Rust. Rust makes high performance data manipulation code much safer, which means developers can move much quicker with more confidence. It's easy to bridge Rust into higher level languages like Python/R to be wrapped into APIs much more familiar to the data science / machine learning users. Finally, Rust offers powerful features for concurrency, which allows developers to parallelize data manipulation tasks much easier. In this talk we'll use Lance and LanceDB as a source of examples on building high performance data tools for AI in Rust. We'll show you how Rust is used to create blazing fast vector search with hardware acceleration, how Rust helps us create new data management tooling for unstructured data, and how these tools can be exposed in higher level languages like python and javascript. -
09:50 AM - 10:10 AM
Mike Band Sr. Manager, Research & Analytics @ NFL Next Gen Stats
Open-Source Football: A Brief History of the NFL's Big Data Bowl Competition ...
For the past six years, the National Football League has hosted the annual Big Data Bowl, an open-source data competition. This event invites data scientists, analysts, and fans alike to develop innovative advanced metrics using Next Gen Stats player-tracking data. In my talk, I will explore the competition's history and highlight submissions that have led to the creation of several key NGS metrics. These metrics are not only featured in every live broadcast but are also utilized by all 32 teams. Don't miss the seventh annual Big Data Bowl coming Fall 2025. -
10:10 AM - 10:40 AM
Break
-
10:40 AM - 11:00 AM
Emily Zabor Associate Staff Biostatistician @ Cleveland Clinic, Department of Quantitative Health Sciences
Reporting Survival Analysis Results with the gtsummary and ggsurvfit Packages ...
Survival analysis is an essential tool to handle censored time-dependent endpoints such as overall survival, which are common across a variety of biomedical and other applications. The survival package in R provides the most essential tools to conduct a survival analysis, including estimating survival probabilities, fitting Cox proportional hazards models, and plotting Kaplan-Meier curves. While the functions are powerful, user-friendly, and well documented, getting publication-ready tables and figures can still be a challenge. In this talk, I will review the basics of survival analysis, and will demonstrate how to take results from the console to the manuscript using the gtsummary and ggsurvfit packages. -
11:05 AM - 11:25 AM
Jared P. Lander Chief Data Scientist @ Lander Analytics
15 Years of Data Science in NYC ...
Back when the meetup got started in 2009, data science wasn't even a thing yet, we called ourselves statisticians or analysts. Within a few short years Columbia had its first data science course, there were multiple data meetups, all with different names and an unofficial data mafia. Come take a look at the New York data community and how it evolved throughout the past 15 years. -
11:30 AM - 11:50 AM
Ipek Ensari Assistant Professor @ Windreich Department of Artificial Intelligence and Human Health, Hasso Plattner Institute for Digital Health, Icahn School of Medicine at Mount Sinai
Smooths, Splines, and the Chamber of Secrets - Demystifying Female Reproductive Health ...
Chronic disorders affecting the female reproductive system often present diagnostic and treatment challenges due to their under-documentation within electronic health records and a lack of objective measures. Multimodal data from mobile health (mHealth) technologies can help close this gap by providing comprehensive patient profiles, insights into symptom patterns, and the interplay between symptomatic variance and personal factors. However, extracting meaningful insights from these noisy, high-dimensional data requires properly addressing their complex longitudinal patterns and irregular sampling. To address these challenges, this talk will investigate generalized additive models (GAMs) using example cases from pelvic pain disorders (PPDs) - a cluster of conditions with many unknowns. To this end, we will employ smoothing functions and mixture models to reveal underlying trends and relationships that may not be immediately apparent. We will use real-life prospective patient data and nonparametric methods that can be used when there is uncertainty in the shape and patterns of the data. -
11:50 AM - 01:00 PM
Lunch
-
01:00 PM - 01:20 PM
Sean Taylor Chief Scientist @ Motif Analytics
Analyzing and Visualizing Event Sequence Data ...
Many business processes can be represented as event sequence data, especially from product instrumentation in web and mobile applications. However, low-level events are challenging to wrangle, model, and visualize. As a result, analysts typically aggregate data before visualization and estimation, discarding valuable information and introducing bias. In this talk I discuss how to work with event sequences directly, with a focus on exploratory analysis and hypothesis generation, and step through interactive visualizations that support these analysis goals. -
01:25 PM - 02:05 PM
Andrew Gelman Professor @ Department of Statistics and Department of Political Science, Columbia University
It’s About Time ...
Statistical processes occur in time, but this is often not accounted for in the methods we use and the models we fit. Examples include imbalance in causal inference, generalization from A/B tests even when there is balance, sequential analysis, adjustment for pre-treatment measurements, poll aggregation, spatial and network models, chess ratings, sports analytics, and the replication crisis in science. The point of this talk is to motivate you to include time as a factor in your statistical analyses. This may change how you think about many applied problems! -
02:05 PM - 02:35 PM
Break
-
02:35 PM - 02:55 PM
Jon Harmon Executive Director @ Data Science Learning Community
I Built a Robot to Write This Talk ...
Are large language models coming for your job? To examine both sides of that argument, I wrote {robodeck}, an R package that uses the OpenAI API to auto-generate a quarto slide deck from as little as a title. See how it helped, where it failed miserably, and how I coerced it to work at least most of the time. -
03:00 PM - 03:20 PM
David Robinson Director of Data Science @ Contentsquare
The Science of Product Development: Bringing Causal Inference to Conversion and Retention Metrics ...
Modern websites track every pageview and click that their users perform, and have a strong interest in using that data to discover friction and smooth the journey. So then why are so many websites still so hard to use? I’ll make the case that the problem is largely a scientific one: even when we have the right data, we lack the conceptual and statistical tools to draw causal conclusions about user behavior. In this talk, I’ll lay out an early vision of what “product science” could be. I’ll introduce journeygrams, a method for quantifying and reasoning about sequential user behavior, and show how they can make product concepts like friction, backtracking, and retention more rigorous and actionable. I’ll include some examples of how typical product problems should be analyzed, and why our new approach is better suited to these problems than classical statistics and ML. These principles could help anyone looking to use data to improve their own products, and I hope will contribute to bringing the causal revolution to product development. -
03:25 PM - 03:45 PM
Alan Feder Senior Principal Data Scientist @ Freelance
RAGtime in the Big Apple: Chat with a Decade of NYR Talks ...
As the adoption of Large Language Models (LLMs) like ChatGPT has increased over the past year, there's been a growing excitement about using these technologies to query existing documents and datasets. However, training your own LLM chatbot from scratch is impossible for everyone except the largest tech companies. Retrieval-Augmented Generation (RAG) is a versatile method for addressing these challenges. I will show how this works with a live demo exploring the past 10 years of NYR talks. -
03:45 PM - 04:15 PM
Break
-
04:15 PM - 04:35 PM
Abigail Haddad Lead Data Scientist @ Capital Technology Group
Automating Tests for your RAG Chatbot or Other Generative Tool ...
Building a Retrieval Augmented Generation (RAG) chatbot that answers questions about a specific set of documents is straightforward. But how do you tell if it's working? Automated evaluation of generative tools for specific use cases is tricky, but it's also important if you want to easily compare performance using different underlying LLMs, system prompts, temperatures, or other parameters -- or just make sure you're not breaking something when you push your code. In this talk, I'll discuss why this kind of evaluation is challenging and review a few options for the kinds of assessments you can create, including using an LLM to evaluate your LLM-based tool. We'll then look at several ways to write automated LLM-led evaluations, including with a library that allows you to easily and with very little coding create complex grading rubrics for your tests. -
04:40 PM - 05:00 PM
Walker Harrison Analyst @ New York Yankees
Kick or Receive? Determining Optimal NFL Playoff Overtime Strategy via Simulation ...
This year's Super Bowl was the first to feature an overtime period under the NFL's new playoff rules, which guarantee that each team will possess the ball in the added time. The San Francisco 49ers opted to have the first possession, subsequently lost, and were roundly criticized for not forcing their opponent to start with the ball. But did they actually make a poor strategic decision? To answer this question, we can simulate overtime periods by re-sampling historical plays under some added constraints. -
05:00 PM - 05:10 PM
Closing Remarks
-
05:10 PM - 06:30 PM
Happy Hour
Friday, May 17
-
09:00 AM - 09:50 AM
Registration & Breakfast
-
09:50 AM - 10:00 AM
Opening Remarks
-
10:00 AM - 10:20 AM
Kelsey McDonald Ticketing Director @ Two Circles
R is for Retention: Using Regression Models to Increase Revenue in Sports ...
A conversation about how we’ve used R in the sports world to build logistic regression models that predict season ticket member retention, and multinomial regression models to identify upsell opportunities. -
10:25 AM - 10:45 AM
Anna Kircher Senior Data Scientist @ EY | AI & Data, FSO
Analyzing Consistency in LLM Outputs Leveraging Colourful Queries ...
Approaching the GenAI’s black box with the power of colours. My illuminating journey through the mysteries of colour symbolism and its interpretations using ChatGPT and R. Through specific queries about metaphors, saying and meanings of colours, responses are generated. Analysis of said responses is conducted to further interpret and summarize colour perception and interpretation, shedding a little light on the intricate nuances of colour symbolism. By introducing randomness through temperature variation in underlying language models, the creative potential and consistency in responses is explored and shifts in the interpretation of colour symbolism uncovered.Overall leading to unraveling the intersection between language, colours, perception and AI. -
10:45 AM - 11:15 AM
Break
-
11:15 AM - 11:35 AM
John Park Director of Strategic Football Operations @ Dallas Cowboys
Strategic Football Operations: Department Philosophies and Integrating Statistical Applications ...
In this talk, we’ll explore ideas we’ve leaned on to establish an identity for the SFO Department of the Dallas Cowboys, and we’ll unpack how we are integrated into the different elements of traditional football operations. We’ll cover topics such as where we choose to operate on the continuum between theoretical and applied research, the premium we place on manifesting a mindset of humility, clear communication, and collaboration, and the critical importance of trust. These wide-ranging topics are some of the ideas we’re pouring into the foundation of what we are continuing to build in Dallas. -
11:40 AM - 12:20 PM
Hadley Wickham Chief Scientist @ Posit
R in Production ...
In this talk, we delve into the strategic deployment of R in production environments, guided by three core principles to elevate your work from individual exploration to scalable, collaborative data science. The essence of putting R into production lies not just in executing code but in crafting solutions that are robust, repeatable, and collaborative, guided by three key principles: * Not just once: Successful data science projects are not a one-off, but will be run repeatedly for months or years. I'll discuss some of the challenges for creating R scripts and applications that run repeatedly, handle new data seamlessly, and adapt to evolving analytical requirements without constant manual intervention. This principle ensures your analyses are enduring assets not throw away toys. * Not just my computer: the transition from development on your laptop (usually windows or mac) to a production environment (usually linux) introduces a number of challenges. Here, I'll discuss some strategies for making R code portable, how you can minimise pain when something inevitably goes wrong, and few unresolved auth challenges that we're currently working on. * Not just me: R is not just a tool for individual analysts but a platform for collaboration. I'll cover some of the best practices for writing readable, understandable code, and how you might go about sharing that code with your colleagues. This principle underscores the importance of building R projects that are accessible, editable, and usable by others, fostering a culture of collaboration and knowledge sharing. By adhering to these principles, we pave the way for R to be a powerful tool not just for individual analyses but as a cornerstone of enterprise-level data science solutions. Join me to explore how to harness the full potential of R in production, creating workflows that are robust, portable, and collaborative. -
12:20 PM - 01:30 PM
Lunch
-
01:30 PM - 01:50 PM
Wes McKinney Principal Architect @ Posit
The Future Roadmap for the Composable Data Stack ...
In this talk, I plan to review the progress we have made in the last 10 years developing composable, interoperable open standards for the data processing stack, from such infrastructure projects as Parquet and Arrow to user-facing interface libraries like Ibis for Python and the tidyverse for R. In discussing the current landscape of projects, I will dig into the different areas where more innovation and growth is needed, and where we would ideally like to end up in the coming years. -
01:55 PM - 02:15 PM
Max Kuhn Scientist @ Posit
SHINYLIVE IS SO EASY ...
shinylive is an extension to the Quarto open-source scientific and technical publishing system. It enables shiny applications to run locally, without a shiny server using WebAssembly. I’ll show examples and discuss the limitations of using shinylive. -
02:20 PM - 02:40 PM
Hilary Mason Co-Founder @ Hidden Door
Data, AI, and Creativity ...
In this talk, we'll explore the lines between analytics, data science, machine learning, and AI, and what current developments open up in terms of creativity and impact. -
02:40 PM - 03:10 PM
Break
-
03:10 PM - 04:10 PM
Retrospective Panel
Join us for a captivating retrospective panel as we celebrate a decade of the New York R Conference, 15 years of the New York Open Statistical Programming Meetup and the vibrant journey of the Data Science community. Dive into the highlights, memories and collective achievements that have shaped our community's remarkable evolution. Don't miss this nostalgic journey reflecting on the past and embracing the exciting future of data science! ...
Hosted by Jon Krohn, this retrospective panel includes special guests Drew Conway, Emily Zabor, JD Long and Jared Lander. -
04:10 PM - 04:20 PM
Closing Remarks
Workshops

Machine Learning in R
Hosted by Max Kuhn
Wednesday, May 15 | 9:00am - 5:00pm
Join Max Kuhn on a tour through Machine Learning in R, with emphasis on using the software as opposed to general explanations of model building. This workshop is an abbreviated introduction to the tidymodels framework for modeling.
You'll learn about data preparation, model fitting, model assessment and predictions. The focus will be on data splitting and resampling, data pre-processing and feature engineering, model creation, evaluation, and tuning. This is not a deep learning course and will focus on tabular data.
Pre-requisites: some experience with modeling in R and the tidyverse (don't need to be experts); prior experience with lm is enough to get started and learn advanced modeling techniques. In case participants can’t install the packages on their machines, RStudio Server Pro instances will be available that are pre-loaded with the appropriate packages and GitHub repository.
(In-Person & Virtual Ticket Options Available)

Causal Inference in R
Hosted by Malcolm Barrett & Lucy D'Agostino McGowan
Wednesday, May 15 | 9:00am - 5:00pm
In this workshop, we’ll teach the essential elements of answering causal questions in R through causal diagrams, and causal modeling techniques such as propensity scores and inverse probability weighting.
In both data science and academic research, prediction modeling is often not enough; to answer many questions, we need to approach them causally. In this workshop, we’ll teach the essential elements of answering causal questions in R through causal diagrams, and causal modeling techniques such as propensity scores and inverse probability weighting. We’ll also show that by distinguishing predictive models from causal models, we can better take advantage of both tools. You’ll be able to use the tools you already know--the tidyverse, regression models, and more--to answer the questions that are important to your work.
This course is for you if you:
- Know how to fit a linear regression model in R
- Have a basic understanding of data manipulation and visualization using tidyverse tools
- Are interested in understanding the fundamentals behind how to move from estimating correlations to causal relationships
(In-Person & Virtual Ticket Options Available)

Exploratory Data Analysis with the Tidyverse
Hosted by David Robinson
Wednesday, May 15 | 9:00am - 5:00pm
The tidyverse is a powerful collection of packages following a standard set of principles for usability. During this workshop David will demonstrate an exploratory data analysis in R using tidy tools. He will demonstrate the use of tools such as dplyr and ggplot2 for data transformation and visualization, as well as other packages from the tidyverse as they're needed. He'll narrate his thought process as attendees follow along and offer their own solutions.
The workshop expects some familiarity with dplyr and ggplot2—enough to work with data using functions like mutate, group_by, and summarize and to create graphs like scatterplots or bar plots in ggplot2. These concepts will be re-introduced to ensure a smooth workshop, but it isn't designed for brand new R programmers.
The workshop is designed to be interactive and participants are expected to type along on their own keyboards.
(In-Person & Virtual Ticket Options)
Speakers

Andrew Gelman
Professor
Department of Statistics and Department of Political Science, Columbia University
Talk: It’s About Time


Abigail Haddad
Lead Data Scientist
Capital Technology Group
Talk: Automating Tests for your RAG Chatbot or Other Generative Tool

Wes McKinney
Principal Architect
Posit
Talk: The Future Roadmap for the Composable Data Stack

Emily Zabor
Associate Staff Biostatistician
Cleveland Clinic, Department of Quantitative Health Sciences
Talk: Reporting Survival Analysis Results with the gtsummary and ggsurvfit Packages

Sean Taylor
Chief Scientist
Motif Analytics
Talk: Analyzing and Visualizing Event Sequence Data

Ipek Ensari
Assistant Professor
Windreich Department of Artificial Intelligence and Human Health, Hasso Plattner Institute for Digital Health, Icahn School of Medicine at Mount Sinai
Talk: Smooths, Splines, and the Chamber of Secrets - Demystifying Female Reproductive Health


Anna Kircher
Senior Data Scientist
EY | AI & Data, FSO
Talk: Analyzing Consistency in LLM Outputs Leveraging Colourful Queries

Mike Band
Sr. Manager, Research & Analytics
NFL Next Gen Stats
Talk: Open-Source Football: A Brief History of the NFL's Big Data Bowl Competition

Jared P. Lander
Chief Data Scientist
Lander Analytics
Talk: 15 Years of Data Science in NYC

John Park
Director of Strategic Football Operations
Dallas Cowboys
Talk: Strategic Football Operations: Department Philosophies and Integrating Statistical Applications
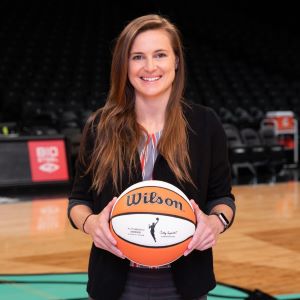
Kelsey McDonald
Ticketing Director
Two Circles
Talk: R is for Retention: Using Regression Models to Increase Revenue in Sports

Walker Harrison
Analyst
New York Yankees
Talk: Kick or Receive? Determining Optimal NFL Playoff Overtime Strategy via Simulation

Megan Robertson
Senior Data Scientist
Freelance
Talk: Not Your College Stats Course: Engaging Stakeholders Through Data Science

David Robinson
Director of Data Science
Contentsquare
Talk: The Science of Product Development: Bringing Causal Inference to Conversion and Retention Metrics

Chang She
CEO & Cofounder
LanceDB
Talk: Building Data Tooling in Rust for Multimodal AI

Jon Harmon
Executive Director
Data Science Learning Community
Talk: I Built a Robot to Write This Talk

Alan Feder
Senior Principal Data Scientist
Freelance
Talk: RAGtime in the Big Apple: Chat with a Decade of NYR Talks
Retrospective Panel
Join us for a captivating retrospective panel as we celebrate a decade of the New York R Conference, 15 years of the New York Open Statistical Programming Meetup, and the vibrant journey of the Data Science community. Dive into the highlights, memories, and collective achievements that have shaped our community’s remarkable evolution. Don’t miss this nostalgic journey reflecting on the past and embracing the exciting future of data science!


Emily Zabor
Associate Staff Biostatistician
Cleveland Clinic, Department of Quantitative Health Sciences


Sponsors
